
The 12 Days of Data Science
On the first day of data science… a one hot encoder term
A one hot encoder is a way to represent categories in a regression or machine learning algorithm. Say for example you wanted to see whether day of the week has an effect on your model. You could build a one hot encoder term called “is_Monday” that is a one when the day of the week is a Monday and a zero when it’s any other day. If the regression model gives a large coefficient for is_Monday then that means Mondays have a very big effect on your model. Garfield… is that you?
On the second day of data science…A binary tree
Let’s talk about binary trees and I’ll keep it simple. Think of a binary tree like a family tree for data. A binary tree starts with a single point, called the root. From that root, the tree branches into two paths, one on the left, one on the right.
You then continue down the branches. Maybe the left side branches again, while the right side doesn’t go any further becoming a leaf node, which is basically the end of that path. A binary tree has many of these leaves, and each branch helps narrow down your options. It’s kind of like playing higher or lower each question halves your choices.
So why do data scientists use binary trees? They’re great for organising data into a hierarchy format, making it easier to sort, search, and process efficiently. In machine learning, decision trees are a model of a binary tree, they are used for classification and regression tasks. In the world of finance, we can use a binary tree to price an option. Essentially we find binary trees all over data science helping us tackle large datasets and optimise algorithms. A nice little gift to put in your stocking,
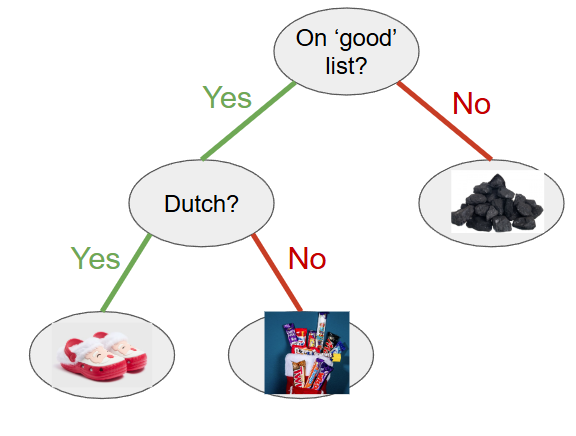
An example of a binary tree and its leaves
On the third day of data science… Three data splits
For this one I’m talking about splitting your data into three parts to be able to find the best model without over fitting. The three data splits are train, test and validation. Training data is used to teach your data science model, like how ChatGPT gorged on the whole of the web to understand language. You use this data to teach patterns and relationships.
After training, you adjust the model’s parameters, using the validation set of fresh data to fine-tune them to get the best possible model. It’s like how ChatGPT might adjust its responses to sound more… sycophantic.
The test data is your final, unbiased evaluation that lets you see how your fully tuned model performs on fresh, untouched data. It’s the ultimate test to ensure your model generalises beyond the data used to generate it.

Three data splits explained using an image of a candy cane split in three
On the fourth day of data science…Four Quartiles Plotting
Ever wondered how we find the middle ground or the average of something? Well think inter quartile range: this is when a set of numbers is divided into four equal parts or ‘Quartiles’, Q1 is the first ¼ or 25%, Q2 is the median or 50%, Q3 75% and finally Q4 makes up the rest.
To find our inter-quartile range we Take Q3 and Q1 and find the difference between, for instance in a company if we wanted to find the wage spread between the middle 50% of employees we would have to calculate the difference between the lowest paid employees and the highest paid how we do this is by taking Q1 from Q3 and the outcome would be our answer if the result is smaller, then it shows that everyone is on a similar wage, if its larger well there's a few more employees getting paid the big bucks.
And the reason? It means our analysis is less affected by the extremes, removing the part timer working one day a week and the CEO raking in the cash. It also helps us see things a little clearer if we plot it.
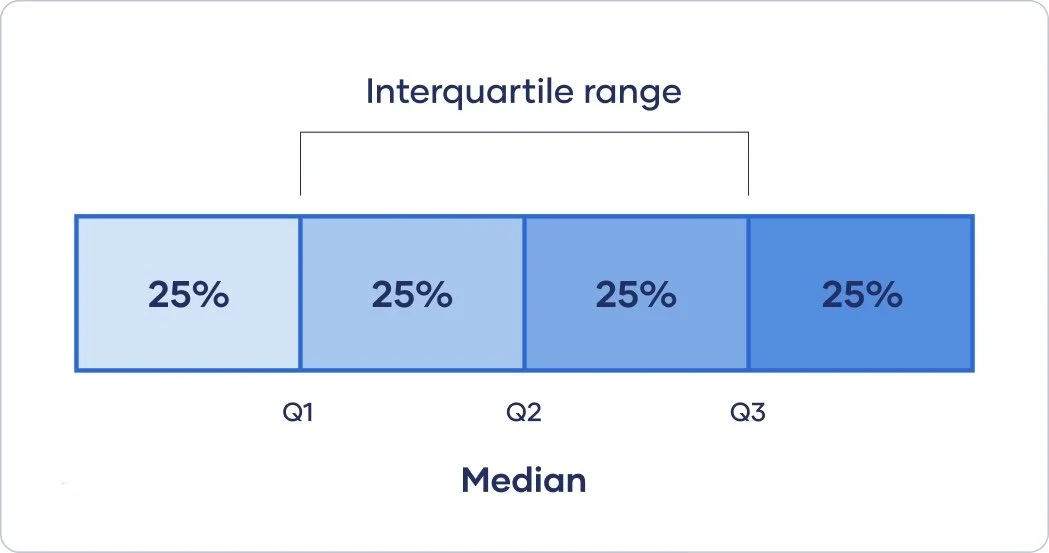
chart showing the Interquartile range
On the fifth day of data science… P value less than five
Often when we’re dealing with data we need to be able to tell whether things we notice are meaningful or just noise. We create a null hypothesis, that’s our no effect or relationship hypothesis. For example we might say that your height and shoe size are unrelated.
Our alternative hypothesis is the claim that there is an effect or relationship, for example “taller people have bigger feet”. We then use data to test whether we can reject our null hypothesis because we have enough evidence to suggest that taller people have bigger feet.
Usually the threshold for deciding whether the evidence is strong enough to reject the null hypothesis is given by the p-value, and a p-value of 0.05 is a common threshold. So really, our line should have been P value less than five percent, but that doesn’t fit the song very well so… shrug.
On the sixth day of data science…Six degrees of separation
Well this one's easy to explain, even I managed to understand this one. so the idea is that we are all connected to each other by at most six social connections, ever been in a room with multiple people and there will be someone who knows a friend of a friend of your friend? And you’re sitting there thinking omg i know them too! And what a small world it is. Well this is exactly that! It shows just how connected humans are globally and could be closer to interacting with those celebrity crushes then we think.
We can also look back throughout the years the most recent one being Covid and how the rule of six models just how easy diseases spread through the population.
How does this relate to data science I hear you ask? Well, think of it like this, data scientists look at all those friend of a friend connections to figure out who knows who, how information spreads, or who might like the same things as you. Basically, they’re turning our ‘small world’ into something you can understand and use, like finding your next connection which linked in and facebook are very good at showing who your friends with or people you may know.
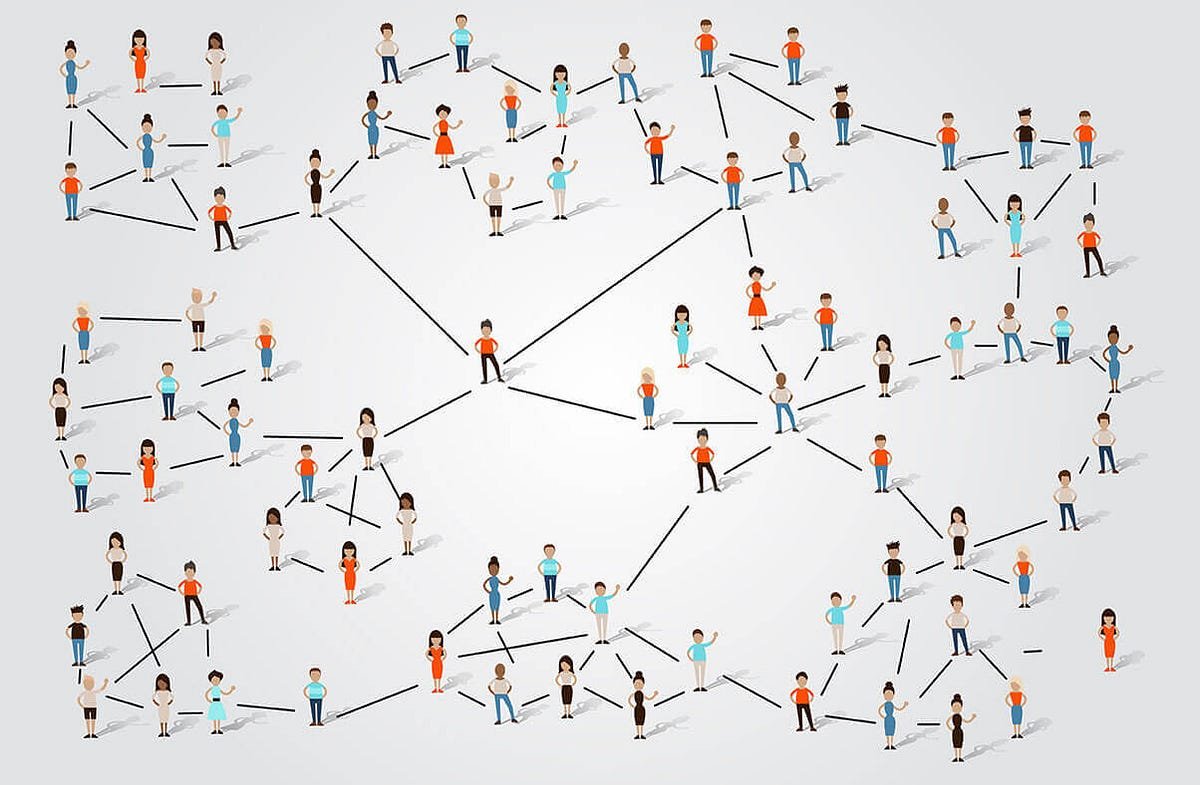
A diagram showing how we are all connected by atleast 6 people
On the seventh day of data science… 7 helps spot fraud
Alright we’re getting a bit niche with this one but we like taking data science to the real world here so we’re going to talk about Benford’s Law.
This is basically an observation that in real-life sets of numerical data, the first digit is likely to be low, often because most sets of numerical data are counting up from something.
So unsurprisingly 1 appears as the first digit about 30% of the time, whereas 9 appears less than 5% of the time. Of course if they were uniformly distributed, each would come up around 11% of the time.
Where this is used in fraud detection is because humans are also not uniform in the way we make up numbers. In fact, when asked to give a number, we tend to give the number seven at a far higher rate than either the uniform distribution or Benford’s Law would imply.
So looking out for a significantly high appearances of the number 7 might well suggest that something has been faked, and that something fraudulent is going on.
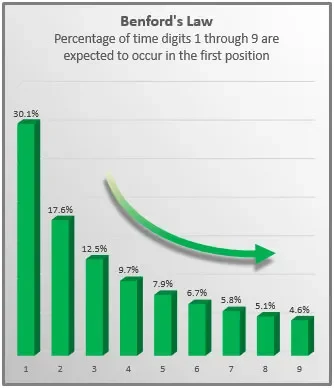
Benford’s Law
On the eighth day of data science… Eight nearest neighbours
This idea is used when we want to understand or make decisions based on what's around a specific data point. We can do this by looking at our nearest neighbours.
Imagine you’ve just moved into a block of flats and you hear a mysterious noise and are wondering where it's coming from. Well it’s most likely going to be from somewhere close by and lets say it's a high rise building and you're on the 56th floor. Well there's no point putting your ear to each door on the first floor right?
So we limit it to our eight closest neighbours, above, below, across the hall, next door and even our diagonal neighbours. Using this we can predict where it's coming from and make a future decision on how we handle it.
In data science we can use this in various ways like assigning a label to a datapoint based on the label of its nearest neighbours (we did this at Halloween to classify how wimpy our team are), recommendations like the YouTube algorithm or finding outliers in data points who don’t really have any neighbours to hang out with.
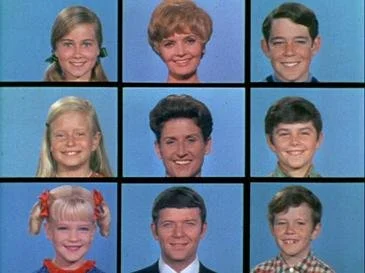
The Brady Bunch…. showing a great example of 8 nearest neighbours
On the ninth day of data science… Nine-ty nine percent confidence
Sometimes we say things like: “children play games for between 2 and 4 hours a day with a 99% confidence level”. What we’re saying there is that if we repeated the analysis on children playing video games 100 times, the true average number of hours spent playing video games in those 100 samples would lie within the confidence interval given by the method 99 times.
So we’re 99% confident that the average number of hours children spend playing video games is within the confidence interval given by the model.
Stat: 99% of christmas cracker toys go in the bin by the end of xmas day
On the tenth day of data science…Ten top ten lists
We’ve all heard of top of the pops right? Or am I showing my age? When I think of top ten lists I automatically refer to the music charts, rather than listening to every song ever made or even narrowing it down to songs released that year can be extremely overwhelming.
We have a way of managing the most popular songs at the time and can shorten the list to its ‘top ten’ . I know radio one has a run through of their top ten hits each week and each artist is hoping to gain that number one spot!.
Why is this useful? Well it highlights the most important information to focus on rather than getting lost with all the data, businesses can benefit from their own ‘top ten’ identifying what parts of the business need the most attention, which performance metrics are most important to track and the most important products, services or features. The applications are endless!
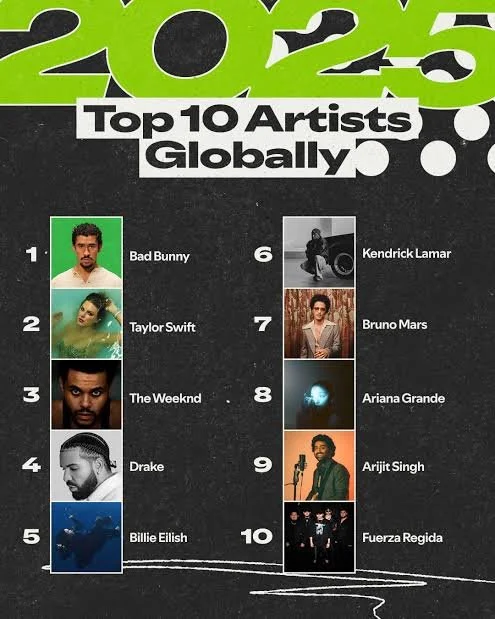
Example of a top ten list for music
On the eleventh day of data science… Eleven ISBN Thing
Maybe you’ve noticed that almost all books have a number on the back, called an ISBN?
If you’ve looked EVEN closer, maybe you noticed that – just sometimes – the ISBN (on older books) ends in an X instead of a digit. Ever wondered why?
If so, congratulations on earning 3 points towards your autism diagnosis… But also you’ve just rediscovered modulo arithmetic!
Since ISBNs are often typed by hand, sometimes people make mistakes entering them. The last digit is a “check digit” there to catch these mistakes. This uses a mathematical sum based on the other digits, from which we keep only the last. A computer can then easily check if the ISBN has a typo.
This is where 11 comes in. Ten turns out to be a poor choice of number system for doing this sum, given its not a prime number. So we actually use a number system with base 11 instead for the sum.
But that leaves one final problem! We’re fine if the remainder is 0-9, but … we need a way to express 10 as a single digit. So ISBN uses the Roman numeral X for a ten.
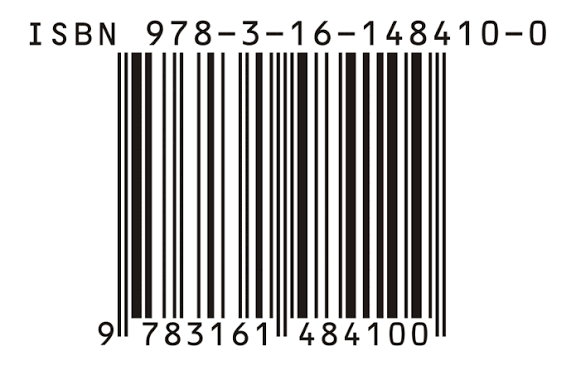
ISBN number on a barcode
On the twelfth day of data science…Twelve Seasonal Forecasts
We will call this one mystic meg, the fortune teller of the data science elements, we use past data to predict future outcomes. Let's give an example.
Well it is Christmas so lets talk shopping, for instance we will say we work at Harrods and whilst it’s busy all year round with genuine customers and tourists we notice from past data there's a spike in sales in December? Well what is happening around then that would encourage such a rise? Xmas duh!
People are buying presents and more than likely an increase of online sales as well as footfall for those last minute buyers who can no longer rely on delivery because its 24th december and well xmas is tomorrow! Men, I'm looking at you!,
We gather this information and make decisions based on what we know, will we need more staff? Ever noticed the need for xmas temp staff? Well this would be why. What about an increase in stock ordering, well you already know it’s going to be busy so you may have to start ordering more batches of stock. You see how important this can be?
And it’s not just Christmas of course. It includes strawberries at Wimbledon or McDonalds restocking for when the teens finish school early on a Friday. Any buying trends affected by the calendar are fair game for data science!
We collect the historical data, identify its patterns and predict the future, now go look into that crystal ball
Merry Christmas everyone
For more of this, come on the journey with us and keep being Evil