
A data science project rarely fails all at once. More often, it takes one small wrong turn and continues confidently in the wrong direction.
That wrong turn can happen anywhere along the pipeline. It might begin with the data. A missing value, incorrect measurement or biased sample. It might appear during training, when a model learns the wrong patterns, during validation, when a serious weakness goes unnoticed, or during deployment, when a prediction is trusted beyond the condition where it works.
That’s when a mistake can become a corporate horror story.
In this post, we’re going through five real corporate horror stories where companies made critical mistakes and suffered catastrophic losses as a result. We will follow each story from the first mistake to the final consequence, then look at the checks and safeguards that could have prevented it.
By the end, you will have a sanity checklist to help you spot the warning signs before your own projects take a wrong turn.
Data Collection - NASA
Let’s start with the Mars Climate Orbiter.
In 1999, Lockheed Martin’s software produced thruster data in pound-force seconds, while NASA’s navigation team interpreted those values as newton-seconds.
Because the units didn’t match, this mismatch affected the spacecraft’s trajectory calculations, and the orbiter was ultimately lost in the martian atmosphere.
That makes this a useful example for the beginning of our pipeline. Data is more than just random numbers on spreadsheets. Every value carries meaning: a unit, a type and a definition. Remove that context and data can produce a catastrophic result.
That is one of the problems we wanted to address when building our PUFF platform. Units are treated as part of the data itself, so compatible values can be converted automatically and incompatible operations can be rejected before they create misleading results.
Leigh has written a post explaining the full story in much more detail, including how the error happened and why this kind of mistake can still happen even after decades have passed.
One wrong turn sent NASA’s spacecraft onto the wrong trajectory. Our next story follows a model that took a different kind of wrong path, learning to repeat the bias hidden in its training data: Amazon’s hiring algorithm.
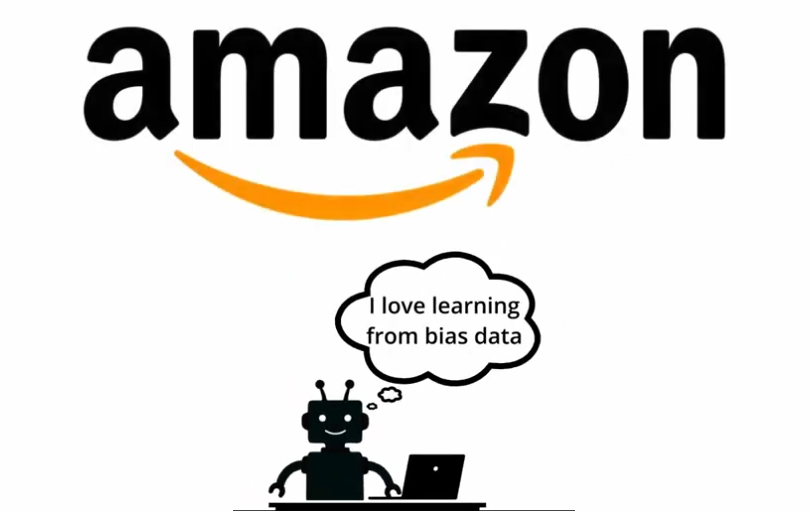
An image of the Amazon logo with a robot underneath on a laptop with a speech bubble saying ‘ i love learning from bias data’
Training data - Amazon’s hiring algorithm
Around 2014, Amazon developed an internal tool designed to score job applicants’ resumes from one to five stars just like their product review system.
The system was trained on resumes submitted to Amazon over the previous decade. Those resumes reflected something shocking: that tech industry was heavily male-dominated. Wow
In effect, Amazon’s system taught itself that male candidates were preferable. It penalized resumes that included the word “women’s,”as in “women’s chess club captain”.
Amazon engineers tried to reduce the problem by removing those specific terms and limiting their influence. That could not guarantee a reliable solution because a model can find other features that carry similar information, even after an obvious keyword has been removed.
Amazon eventually discontinued the original tool.
This is the classic machine learning problem: garbage in, garbage out.
If the training data contains historical bias, the model can learn and reproduce that bias at scale. The algorithm may be working exactly as designed, but the examples it learned from were already carrying the problem.
That is why removing sensitive columns does not eliminate bias automatically. Other variables can act as proxies.
A proper review should examine the features the model relies on, measure performance across protected groups and take place before deployment. That's why training data needs to be checked for representation and bias before a model learns from it.
Biased historical data creates one problem. A lack of representative data creates another. That is what happened with IBM Watson for Oncology.
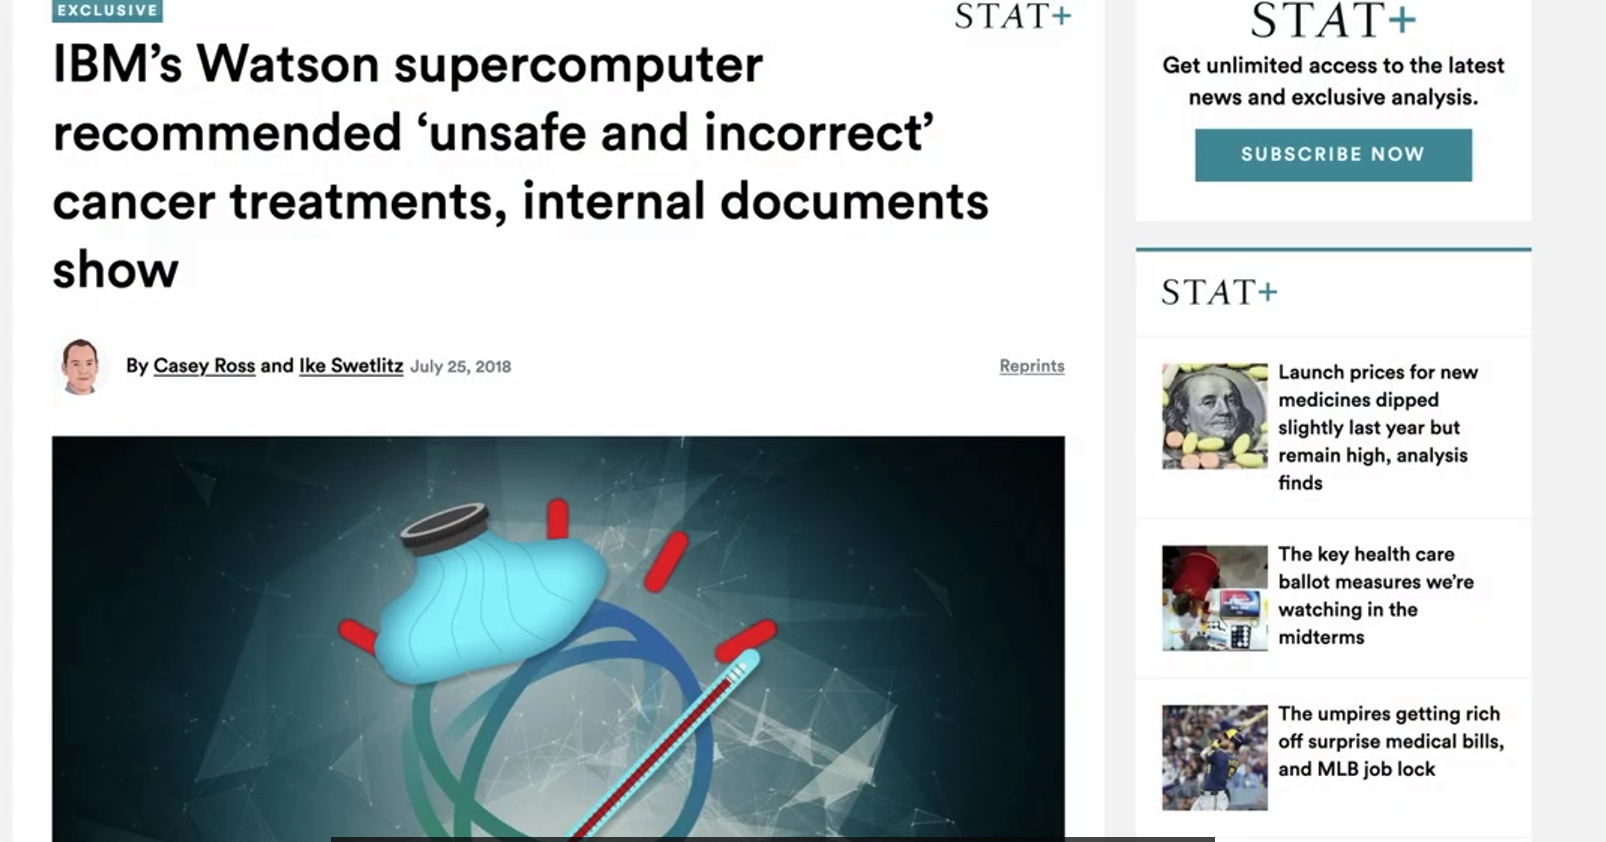
Online article by STAT News regarding IBM’s watson reporting that the system generated unsafe and uncorrect treatment recommendations
Training data - IBM Watson for Oncology
Imagine learning to drive in the UK. You practise on British roads, follow British signs, and learn to drive on the left-hand side. After enough practice, you passed your driving test.
Then you moved to the USA, where traffic drives on the right. The road signs are different, the junctions work differently and traffic in LA is worse than London.
Your driving skills may still be useful, but your original training didn't prepare you for every situation on the new roads. That is similar to what happened with IBM Watson for Oncology, an AI system designed to support cancer treatment decisions.
IBM developed the system in partnership with Memorial Sloan Kettering. Internal documents later reported by STAT News describe Watson as relying heavily on a relatively small set of synthetic or hypothetical cancer cases created by doctors and IBM engineers.
The recommendations reflected the preferences of a limited number of specialists rather than a broad analysis of real patient outcomes.
Watson was then expected to work across different hospitals, patient populations, clinical environments and situations that could differ significantly from the examples it had studied.
The limitations became clear in internal testing. STAT News reported that the system generated “unsafe and incorrect” treatment recommendations. One example involved a hypothetical patient with severe bleeding who was recommended a drug that could worsen the bleeding.
MD Anderson Cancer Center spent more than $62 million on its Watson-related oncology project. An audit found that the system had not been used on actual patients before the project was suspended.
The system had learned the patterns in its training examples, but those examples were too narrow to establish that its recommendations would generalise to the wider medical environment.
The lesson is that training performance tells you how well a model learned its original environment. It doesn't automatically tell you how well the model will perform after the environment changes. Before deployment, you need to test the model on the population, conditions and edge cases it will actually encounter.
Now imagine that a model performs extremely well during development. The metrics look excellent. Every chart is reassuring. That is precisely when the trap opens because looking right and being right are two different tests.
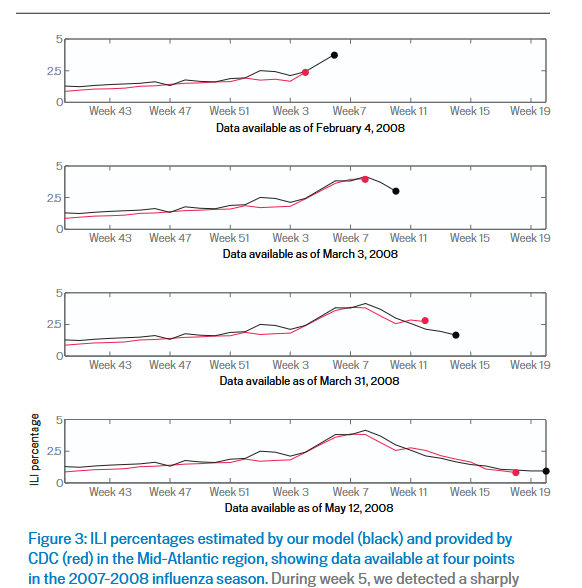
Archive research showing data at four points in the 2007-2008 influenza season
Validation - Google Flu Trends
Validation asks whether a model continues to work when it encounters new data.
Google Flu Trends was launched in 2008 with an ambitious goal: to use Google search activity to estimate flu outbreaks faster than traditional reporting systems, including the data collected by the US Centers for Disease Control and Prevention, or CDC.
The idea was simple. If searches for symptoms, medication, and illness began to increase, Google could use those patterns to estimate where flu activity was rising.
At first, the system appeared to work extremely well. It produced predictions quickly and seemed to outperform the CDC’s reporting system, which relied on data collected from doctors and health centres.
That success created a problem. Google Flu Trends was treated as thought its speed and scale meant it was also more reliable.
During the 2012-2013 flu season, the system substantially overestimated flu activity. Later analyses found that Google’s model said about 11% of doctors visits were for flu. The CDC’s data said about 4-5%. Roughly twice as many ‘flu cases’ as actually existed.
But between you and me, how often do you search for symptoms even when you do not actually have the illness? You might be curious, worried about someone else, or reacting to something you saw in the news.
These searches do not necessarily mean that you have the flu. Google Flu Trends was treating them as proof that flu activity was increasing. So the model kept producing confident predictions but those predictions no longer matched reality.
Validation needs to continue after a model is launched. It needs to be repeatedly compared with reliable ground-truth data. Google Flu Trends wanted to out-predict the CDC. Instead, it demonstrated what researchers later called “big data hubris”: the assumption that large scale data can replace traditional data collection and analysis.
A large dataset can provide useful insights, but it still needs to be tested against reality. Without those checks, a model can continue along the wrong path long after its predictions have stopped reflecting the real world.
The consequences of weak validation may begin with an embarrassing public prediction.
During deployment, the financial consequences can be much greater.

Image of Zillow’s logo
Deployment- Zillow Offers
Zillow is an online real-estate company that helps people search for homes and estimate what properties are worth. Its valuation tool, called Zestimate, uses data such as property records, tax information, recent sales, and details about the home to produce an estimated market value.
The final wrong turn came when Zillow tried to use that data to make house flipping profitable at scale.
Through Zillow Offers, Zillow claimed it could identify promising homes, estimate their market value, predict renovation costs, and flip properties profitably at scale. The strategy sounded simple: buy a home, improve it, and sell it for more than the total cost.
But Zillow’s own data showed that a Zestimate was only an estimate. For off-market homes, its median error rate was 7%. On a $400,000 property, that could mean an error of around $28,000 and enough to erase the expected profit once renovation, financing, taxes, and selling costs were included.
During 2021, Zillow continued buying homes as the market changed. Some properties were purchased at prices that no longer made sense when Zillow tried to sell them.
The company recorded an inventory write-down of roughly $304 million, cut around 25% of its workforce, and shut down Zillow Offers. The total cost of winding down the business was expected to exceed $500 million.
The failure came from treating an uncertain estimate as precise enough to support repeated, large financial commitments. At scale, small prediction errors can become enormous losses.
That is the deployment lesson: before acting on a model’s prediction, decision-makers need to understand its error margin, test how the strategy performs under worse conditions, and keep monitoring whether the model still reflects reality.
Every one of these stories began with a small, plausible mistake: a unit mismatch at NASA, biased resumes at Amazon, narrow training cases at IBM Watson, overconfident validation at Google, and an estimate treated as certainty at Zillow.
The pattern is the same: a project takes a wrong turn, then continues confidently in the wrong direction until the cost becomes impossible to ignore.
Before your next data science project goes live, run through this quick sanity checklist:
Data: Are units, types, and definitions explicit and enforced?
Training data: Does it represent the population and conditions where the model will be used, and have you checked for bias across groups?
Validation: Are you testing on data that matches the real deployment environment, and do you keep comparing predictions to reliable ground truth after launch?
Deployment: Do decision‑makers understand the model’s error margins, and have you stress‑tested the strategy under worse conditions with ongoing monitoring?
Our closed beta is now Live. Sign up via the link below and keep being Evil