
Yes, You Can Do Spatial Data Science
So your boss set you a task: find the best possible location for our next physical store. “You’re a data scientist”, they say “so you should be able to get the best answer quickly”. Let’s pretend this is the perfect fantasy and you have the data you need, the locations your ideal customers spend most time in, prioritised by the biggest spenders.
So you come back: “We should launch a shop in Battersea!”. Your boss nods and goes: “Great, where in Battersea?” And that’s where you’re stuck. You know Battersea is where all the cool kids hang out but that’s not the same as knowing which available commercial lots are in high footfall areas that said cool kids frequent. If your boss wanted to get the answer Battersea, they probably would have googled around and come up with a similar conclusion. But from a data scientist, they want specificity.
To answer this question, you need to learn about a lesser known area of data science: Welcome to Geospatial data science.
Why you should care about spatial data science
My first foray into data science was when I was trying to understand how oil moved around the world for European Scope 3 regulation. For those of you not up to date with the latest European Sustainability initiatives, Scope 3 is a reporting standard that looks to capture the indirect emission footprints of companies. So that’s not the emissions the companies themselves generate, but the emissions of their supply chains, or their employees commuting to work. A deep dive into Scope 3 reporting is outside of the scope of this video but I wanted to use it to show how spatial data science can slip into a normal data science role.

Reporting standard Corporate value chain scope 3
Because in order to calculate the emissions of your supply chain, you need to understand the carbon footprint of all of its component parts, including how things are shipped around the world. But just because you know the plastic in your oil came from a US refinery that mostly refines Saudi Arabian oil, doesn’t really give you any information about the carbon impact of how that oil got here. That’s where spatial data science comes in.
Because spatial data science is, at its most fundamental, data science with locations attached. It’s the ability to restrict all areas where your ideal store clients live down to just the ones that have lots with commercial zoning. It’s the ability to manage the optimal distribution of water in a drought. And it’s the ability to calculate the carbon cost incurred shipping oil around the world according to the routes the ships actually take, not just as the crow flies.
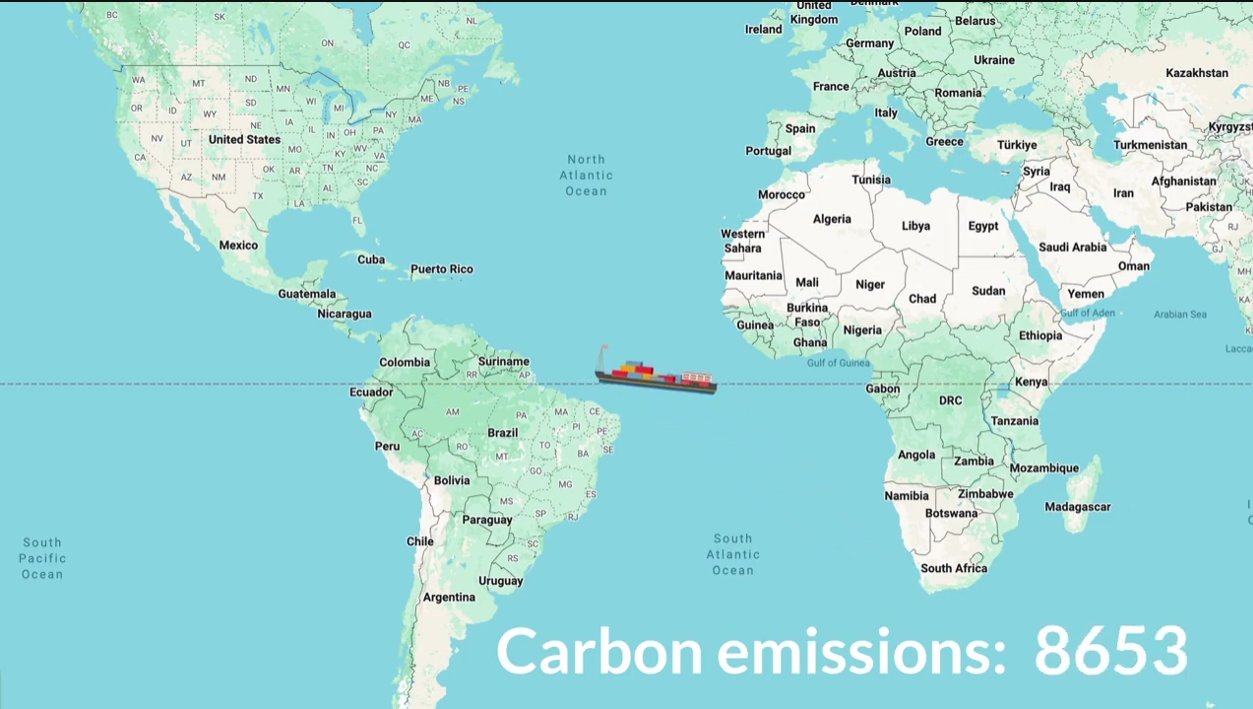
map showing route in which ships actually take and the carbon emissions
So in this post series we’re going to break down some important fundamentals of spatial data science from the perspective of a data scientist tasked with solving geospatial problems. That means that I might not be giving you the perfect method or optimal theory for solving all of your geospatial problems. So if you’re an expert on this topic already, I’m not going to take umbrage with you sharing your tips with us.
But for data scientists new to the world of geospatial data, I will be giving you the tools you need to get off the starting block and if you stick around and finish reading this post I’ll even suggest a little project you can get stuck into to apply some of this stuff as well.
So let’s kick it off with a very fundamental question: What even is geospatial data anyway?
What is spatial data science?
So geospatial data is any kind of data that has a concept of space or location baked in. For example, this could be the latitude and longitude of the centre of capital cities in the world. It could be the locations of all supermarkets in London. It could even be the world map of your favourite Pokemon game. No, I will not be accepting critique of my Pokemon gaming choices.
The important thing to note is that there are two key concepts here: Where things are and how far away they are from each other.
Where things are is a simple enough concept. It’s where x marks the spot, the address or location at which the thing is. There are a number of ways in which we can refer to the location of something but if I ask you how close 20 Fenchurch Street is to 10 Downing Street, unless you know London fairly well, those two addresses give you absolutely no concept of how to actually answer that question.
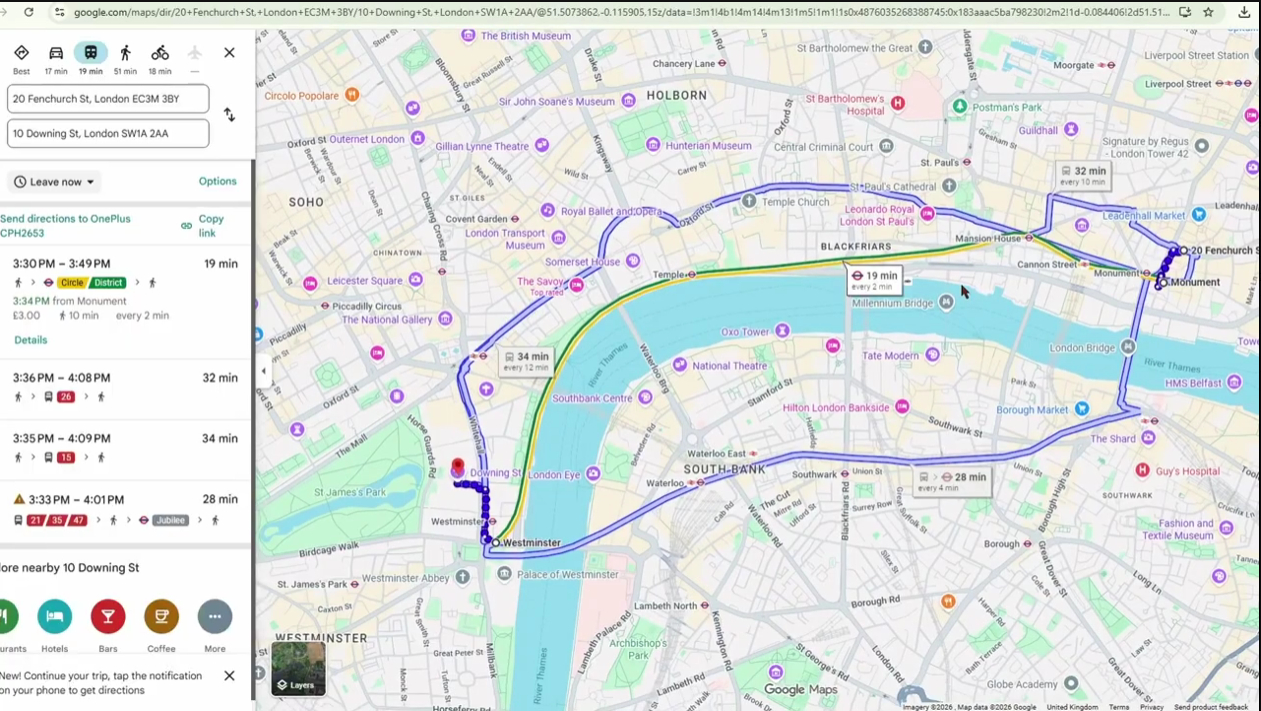
Map showing route from two points in London
That’s why most locations for data science are given using a latitude and longitude coordinate system, where latitude runs between -90 and 90 (south to north pole) and longitude runs from 0 to 360. That doesn’t have to be the only method of identifying coordinates. Mathematicians have spent significant time playing with different coordinate systems and there are a variety already established just for mapping the Earth. But let’s be real, most of the data science you’re going to be doing is going to end up using lat/long coordinates or something similar so the discussion of different coordinate systems is well outside of the scope of this post.
A lat/long pairing, however, is incomplete information. In the example of capital cities I gave earlier, the lat/long often just describes the centre but tells us nothing about where the city begins and ends. Is Staten Island a part of New York City? Who knows? The lat/long centre doesn’t tell us. You might give me the exact lat/long coordinates of the bookshop in the shopping centre but that doesn’t tell me what floor it’s on.
In a similar vein, the concept of “how far away things are from each other” has its own intricacies as well. If you’re asking how far London is from Sydney, you’re not asking me to stick a ruler through the centre of the Earth and tell you. You’re more likely to be asking for the distance traced over the Earth’s surface. Or maybe you’re actually asking for time. 17,000km might not be something that’s meaningful to you, but 24 hours in a plane is.
But London to Sydney in all those configurations is always a somewhat straight line distance, ignoring the detour for the layover. In reality if you’re asking how far away your friend’s house is, it doesn’t matter if it’s just two miles if it requires weaving around complicated country roads or changing tube lines twice. The concept of distance is variable according to the use case you’re using.
If there’s one thing I want you to get from this post or the Evil Works blogs in general, it’s this: Before you can even start to do data science, you need to understand the actual problem you’re trying to solve. Not the maths you’re going to use, not even the dataset you need to tidy up. Your first step is understanding the fundamental business or life problem that comes your way. Only then can you make decisions about the maths and data you use.
So with this in mind, let’s look at my problem from earlier. How do I calculate the carbon cost of transporting the oil used in my plastic? In order to answer this question I need those two things: location and distance. Let’s talk about what this would look like.
Real world worked example
So if I start by thinking about location. In order to calculate my shipping cost, I need to understand how oil gets from A to B, so I need to decide what that A to B is. Now the reality of oil shipped around the world is that it gets extracted, it likely goes into pipelines or into trucks. For the purposes of this exercise, we’re going to look at the emissions only from the literal shipping, that’s oil on tankers moving across the sea, so we’ll make the assumption that the pipeline or trucks take the oil to a port where it’s loaded onto a tanker to set sail around the world.
On the other end, the reverse likely happens. The oil is taken from the tanker and loaded into a pipeline or onto a truck and taken directly to the refinery. The oil started at point A, where it was extracted, and ended at point B, the refinery.
But as I just emphasized, the only part we care about for this part of the calculation is the shipping, so really our A is the port from which the oil tanker leaves and B is the port of its destination.
It’s at this point in which I make my first domain knowledge informed decision. Shipping ports are often pretty big, especially ones that take in large volumes of oil. As a result, you could well argue that I’m in a situation where a lat/long pair for the centre of the port isn’t going to cut it. I’m going to need an exact location of where in the port the oil will be deposited.
But data science is an optimisation problem in many ways. I could go looking for that information, build an entire dataset with the exact locations within ports that oil tankers deliver (it doesn’t exist already, I tried) and deliver the project 6 months late. Or I could realise that the distance within a port is tiny compared to the distance these ships have travelled across the world, and in this particular use case, the centre point of the port is probably good enough for a reasonable approximation for this project. So I grab the general lat/longs of the port and call it a day. Location problem solved.
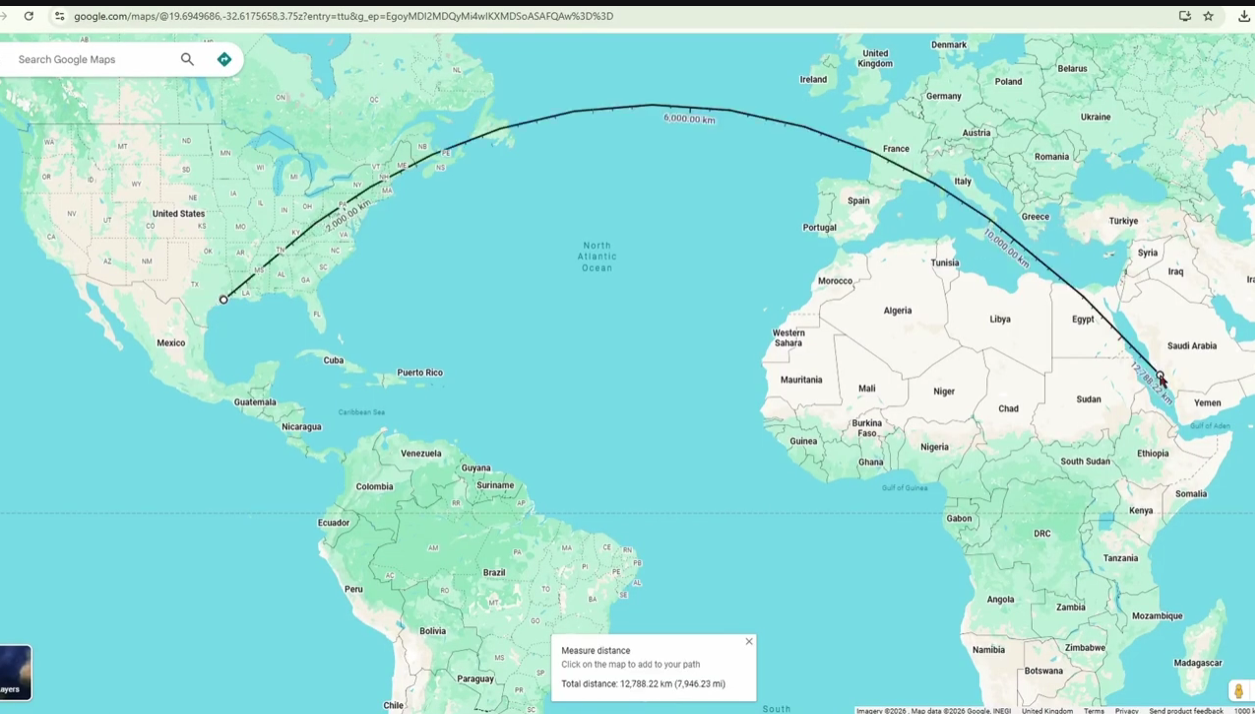
Where the real fun comes though is from working out the distance and this is where the project of this post comes in. It’s a small one to kick you off but don’t worry, we’ll be doing more advanced stuff as we delve deeper into the world of spatial data science.
So the challenge is: How do we calculate the distance from our extraction port to our refinement port?
A challenge for you
The first is simple, our basic “as the crow flies” distance. If you put your finger on the map of the world at Yanbu port, the largest oil port in Saudi Arabia, and draw it in a straight line to the Port of Houston, one of if not the largest oil port in the US, what distance do you get?
For those of you who know your geometry, you’ve probably worked out it’s the Euclidean distance without needing to calculate it. And if the distance between the two ports was small, say within the same town, this might be a reasonable approximation of what the distance actually is. But we’re talking about shipping oil around half the world and while the horizon may look flat from your doorstep, the reality is that the Earth has curvature and this needs to be taken into account in our calculation.
Your next challenge then, is to calculate the Haversine Distance, the distance between two points on the great-circle sphere. This one requires some trigonometry or you can just use the sklearn haversine_distances implementation. Depends how deep you want to go, your choice.
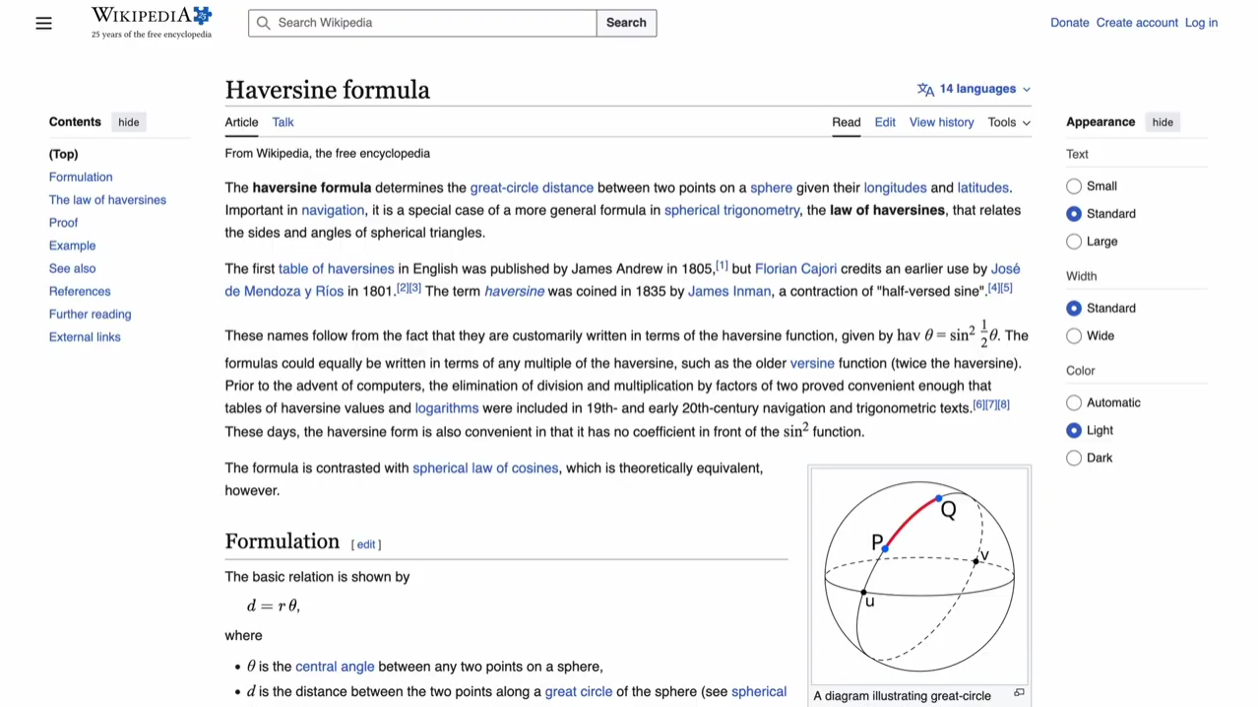
Wikipedia Page for Haversine formula
This is better because it’s far more accurate to the actual distance between Yanbu and Houston but as you’ve probably noticed by now, we’ve got a bit of a problem, and that’s the fact an oil tanker can’t plough straight through Egypt.
We’ll do a more detailed video on how to create actual routes for data science (and spoiler, I did something similar for a Halloween post optimising Bart’s Trick or Treating route around Springfield which you can find linked) in a later video but for now a way you might overcome this is to plot a route, a path leading from Yanbu, up through the Suez Canal, through the Mediterranean, the Strait of Gibraltar and across the Atlantic Ocean.
One way to do this is piecewise, breaking down the route into as many checkpoints as you need to stay in the ocean and calculating the distance between them all, adding them up to get your final result.
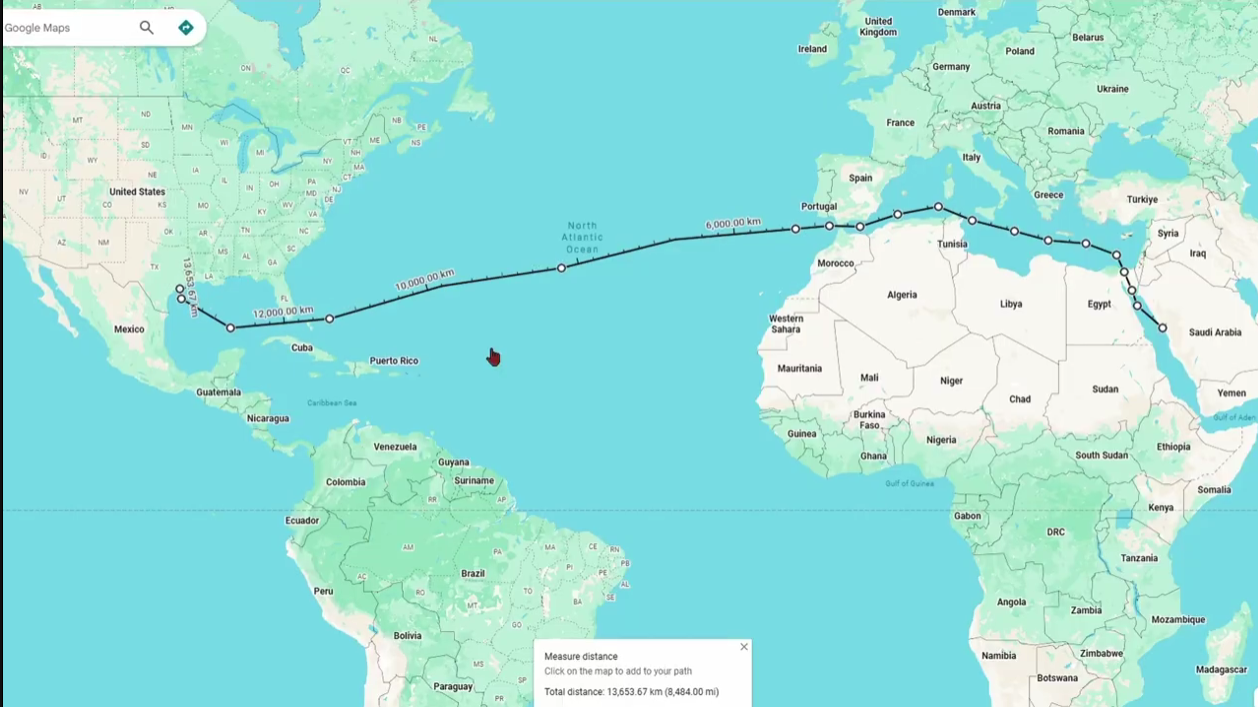
Map of the many checkpoints and distance between them from Saudi Arabia to the US
And the last challenge requires a bit of domain knowledge, which is why I harp on so much about understanding your business problem. I know, because I’ve done the research, that oil tankers from Saudi Arabia to the US don’t go through the Suez Canal.
It’s such a tight choke point that ships are vying for the opportunity to pass through and where demand is high and supply is low, that’s where the money making opportunity is. Passing through the Suez Canal is very expensive so oil tankers to the US just don’t. They actually go around the Cape of Africa before making their way back north to the states.
So your challenge, should you choose to accept it, is to calculate the distance of an oil tanker traveling to the US via all four methodologies. Let us know how you got on and what challenges you came across.
We’re not done with distance for now as there are a number of interesting things I could say about it and we also have to dive deep into when lat/long centre points just won’t cut it for locations either so keep an eye out so you don’t miss both those posts on spatial data science
Our closed beta is now Live. Sign up via the link below and keep being Evil