
Hypothesis testing for data scientists
What is Hypothesis testing?
+40% revenue. Looks great on your dashboard. Until your boss asks: “What caused it?”
You changed the homepage, pricing, and checkout.
Sales went up but you have no idea why. Are your customers actually price sensitive or was it just a change in the wind? So you decide to simplify it. You change one thing: the checkout button colour.
Conversions go from 10% to 12%. Looks like a win. But maybe those users were just more likely to buy anyway. Maybe it was payday.
The increase might be real, or it might be noise. This is why hypothesis testing exists.
In real life, data is messy. Sales go up and down naturally, users behave differently every day, and sometimes things improve even if you do nothing.
If you look at a +40% increase and say “that worked,” you’re not doing data science, you’re just making up a story with numbers. The real question is how you separate actual impact from random noise.
Today we’re going to take a look at hypothesis testing. What it is, how it works and how you can use it to make actual decisions instead of relying on guesswork.
The basics of hypothesis testing
The basics of hypothesis testing are as follows: Hypothesis testing starts with a default assumption: this change had no effect. That’s your null hypothesis.
Then you ask one question: if there was truly no effect, how likely is it that I’d still see this result? That probability is your p-value.
Say your p-value is 0.5. That means if your change did nothing, you’d still see a result this big half of the time. A coin flip. That’s not evidence of anything. Say it’s 0.2. Now you’d see it 1 in 5 times by chance alone. Still not convincing.
But if it falls to 0.02, things start to shift. Now you’re saying: if nothing actually changed, as a result this extreme would only show up 2% of the time. That’s unusual.
And this is the key turning point: at some level of “unusual,” the explanation of random noise stops being convincing. By convention, that cut off is 5%.
So when your p-value drops below 0.05, you reject the null hypothesis and it's not because you’ve proven your change works, but because the “nothing happened” explanation no longer fits the data very well. And that distinction matters more than it sounds.
But notice what you're not saying. You're not saying "this definitely worked." You're saying "it's unlikely this happened by chance." That's a subtle but important distinction, and it's actually a known limitation of this entire approach. Frequentist statistics, which is what we've been describing, can only make probability statements about data.
It cannot tell you the probability that your hypothesis is actually true. It tells you how surprised you should be by your results, not whether your results mean what you think they mean.
And that's actually a known limitation of everything we're covering today. There's a whole other approach called Bayesian statistics that flips the question around entirely but that's its own topic . For now, just hold onto this: a low p-value is not proof. It's evidence.
Keep that difference in your head and you'll avoid the most common mistake people make reading these results.
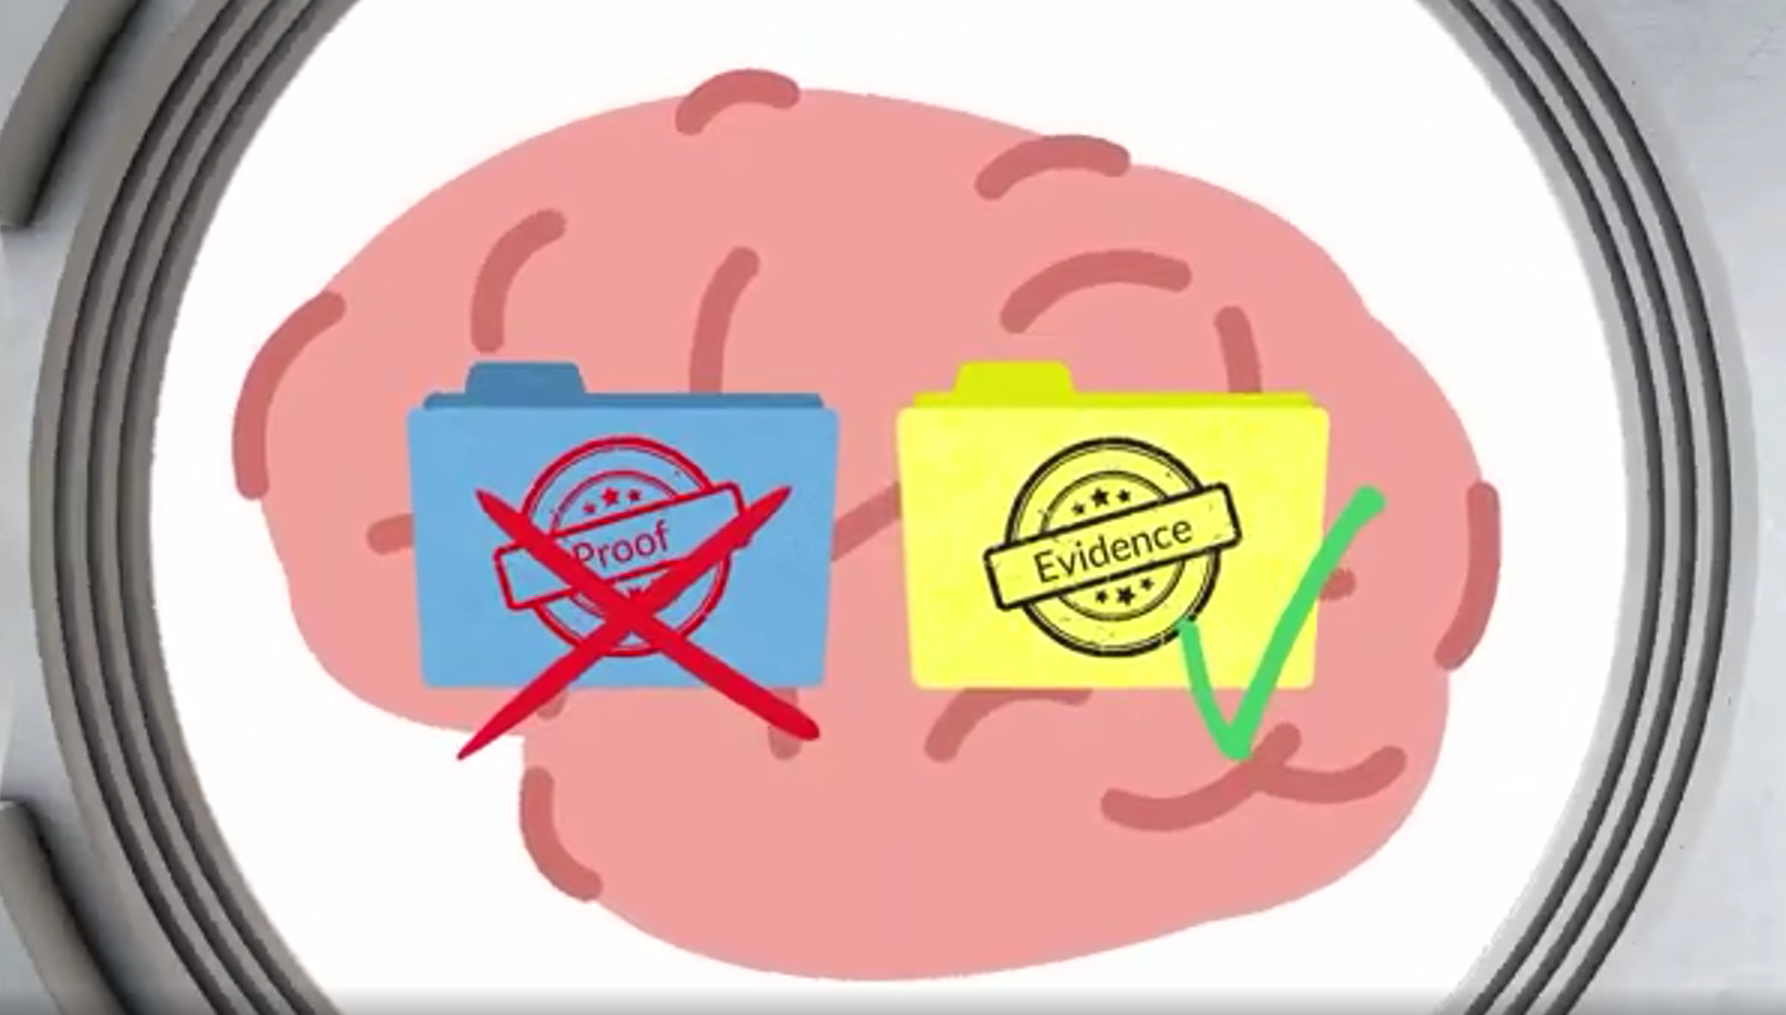
a low p-value is not proof. It's evidence.
Decisions before run hypothesis testing
Before you run any test, there are a few decisions you need to make.
The first one sounds obvious but it's where most people go wrong. You need one defined metric before you see the data, not after.
Is it the conversion rate? Average order value? Time on page? Pick one.
If you wait until the results come in and then choose the metric that moved, you're not doing hypothesis testing, you're just finding a number that supports whatever you already wanted to believe. This is called p-hacking, and it's more common than anyone admits. One change, one metric, decided in advance.
Once you have your metric, you need to make one more decision before you run anything. Are you looking for a change in one direction, or any direction? If you change a button color and only care if conversions go up, that’s a one-tailed test. You’re focusing on one side of the distribution. But if the change could go either way, up or down, that’s a two-tailed test.
Does the new neon green button colour encourage sales or does it actually put people off?
You’re watching both ends.
The rule of thumb is simple: unless you have a strong reason to only care about one direction, use a two-tailed test. It’s more conservative, harder to hit significance, and that’s the point. One-tailed tests are easier to pass, which is exactly why they get abused.
Now you know what you’re testing and which direction you care about. The next question is what test you actually run. Most people stop here and Google “which statistical test should i use” and just copy whatever comes up first.
So let’s try to understand the situation first. So instead of giving you a formula lookup table, let’s talk about what’s actually happening in the real world when each of these tests show up.
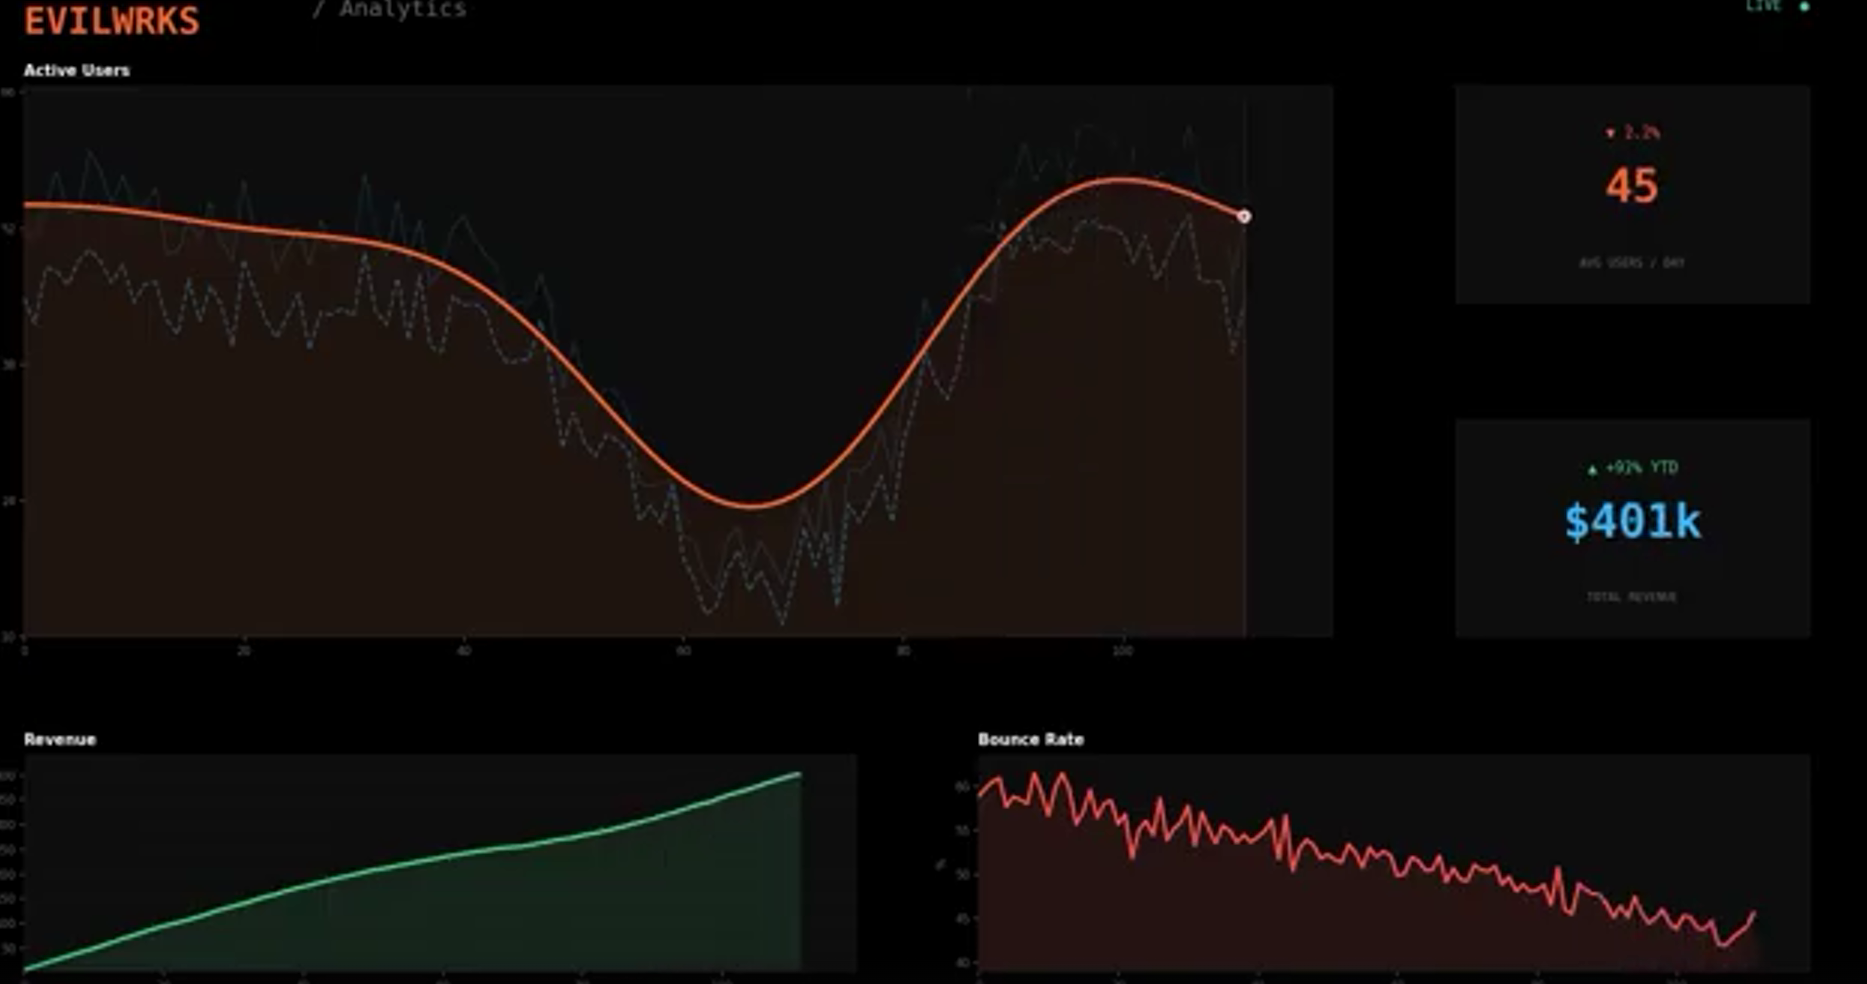
Theorised Graphs showing stable data
Which test should you run?
Imagine you have thousands of users going through checkout. Your data is stable and the variance is already well understood.
In order to find out whether the spike you see is real, the question becomes how far your observed result is from what you expected, relative to how much variation you normally see. That’s what the z-test measures. It standardizes the difference between your observed mean and the expected mean, scaled by the variability in the data.
If your conversion rate jumps, this tells you whether that jump is actually unusual or just part of normal fluctuation. This is what large-scale, stable data looks like.
Now make it more realistic. You don’t have thousands of users, you have 25.
And you don’t have years of historical data telling you how much conversion rates normally bounce around. So you calculate the variance yourself, from your sample. The problem is that the estimate is uncertain too. With 25 data points, if you happened to catch a few unusually good or bad days, your variance estimate is skewed and you don’t have enough data to smooth that out. The estimate itself is unreliable.
That’s the situation the t-test is designed for. At a high level, it works exactly like the z-test. You're still measuring how far your result is from what you'd expect, scaled by variability. But the key difference is where that variability comes from.
With a z-test, you plug in a known population variance. Something stable, backed by lots of prior data.With a t-test, you don’t have that luxury.
You estimate it from your sample. And because that input is unreliable, the test adjusts. So you’re not just uncertain about the result. You’re uncertain about how uncertain you are.
So the t-distribution spreads wider to reflect that. The smaller your sample, the wider it spreads, and the harder it gets to claim significance. That's not a flaw. That's the test being honest about what you actually know.
So the choice comes down to: do you know the true variance in the dataset, or are you estimating it? But that assumes your outcome is a number in the first place. What happens when it isn’t?
Say you run an A/B test on your checkout page. 500 users see the old design, 500 see the new one. On the old design, 80 convert. On the new one, 110 convert.
You now have a table: two groups, two outcomes, raw counts. That's not an average, that's a pattern. And the question is whether that pattern is different from what you'd expect if the design made no difference at all.
Now scale it again. You’re no longer comparing two groups, you’re comparing three or more. Maybe you tested different button colors across multiple regions or different versions of a page.
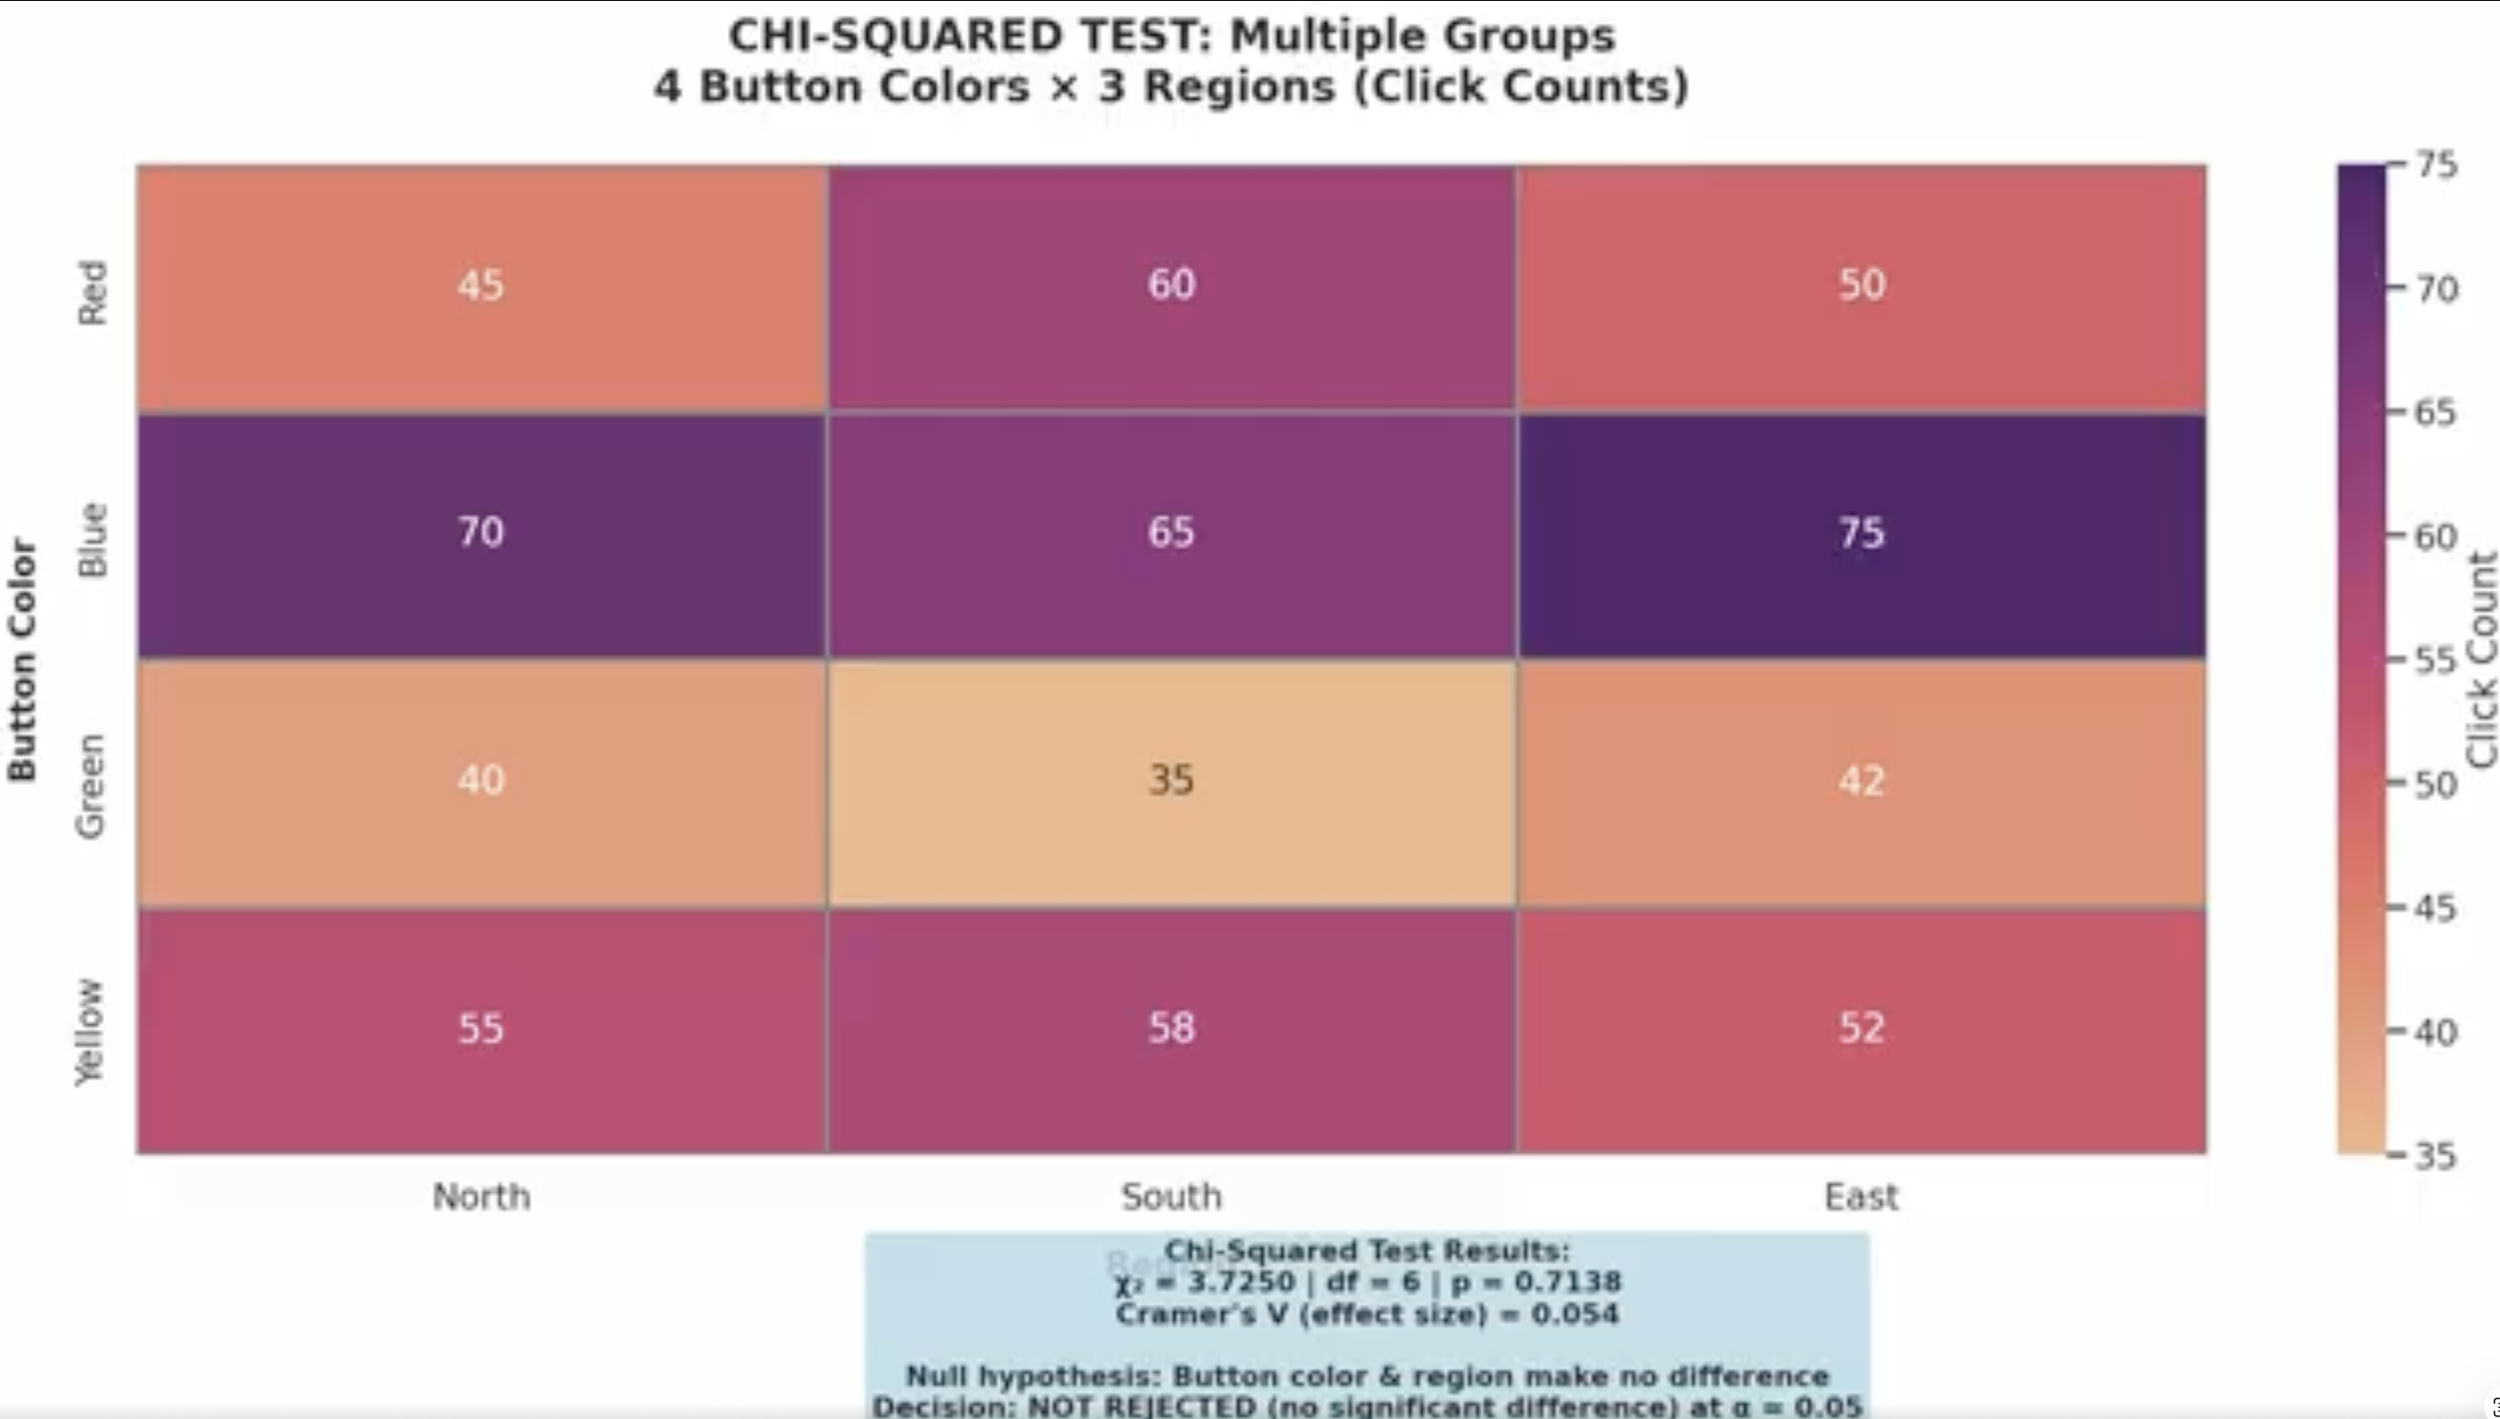
Table showing different coloured buttons and the click counts
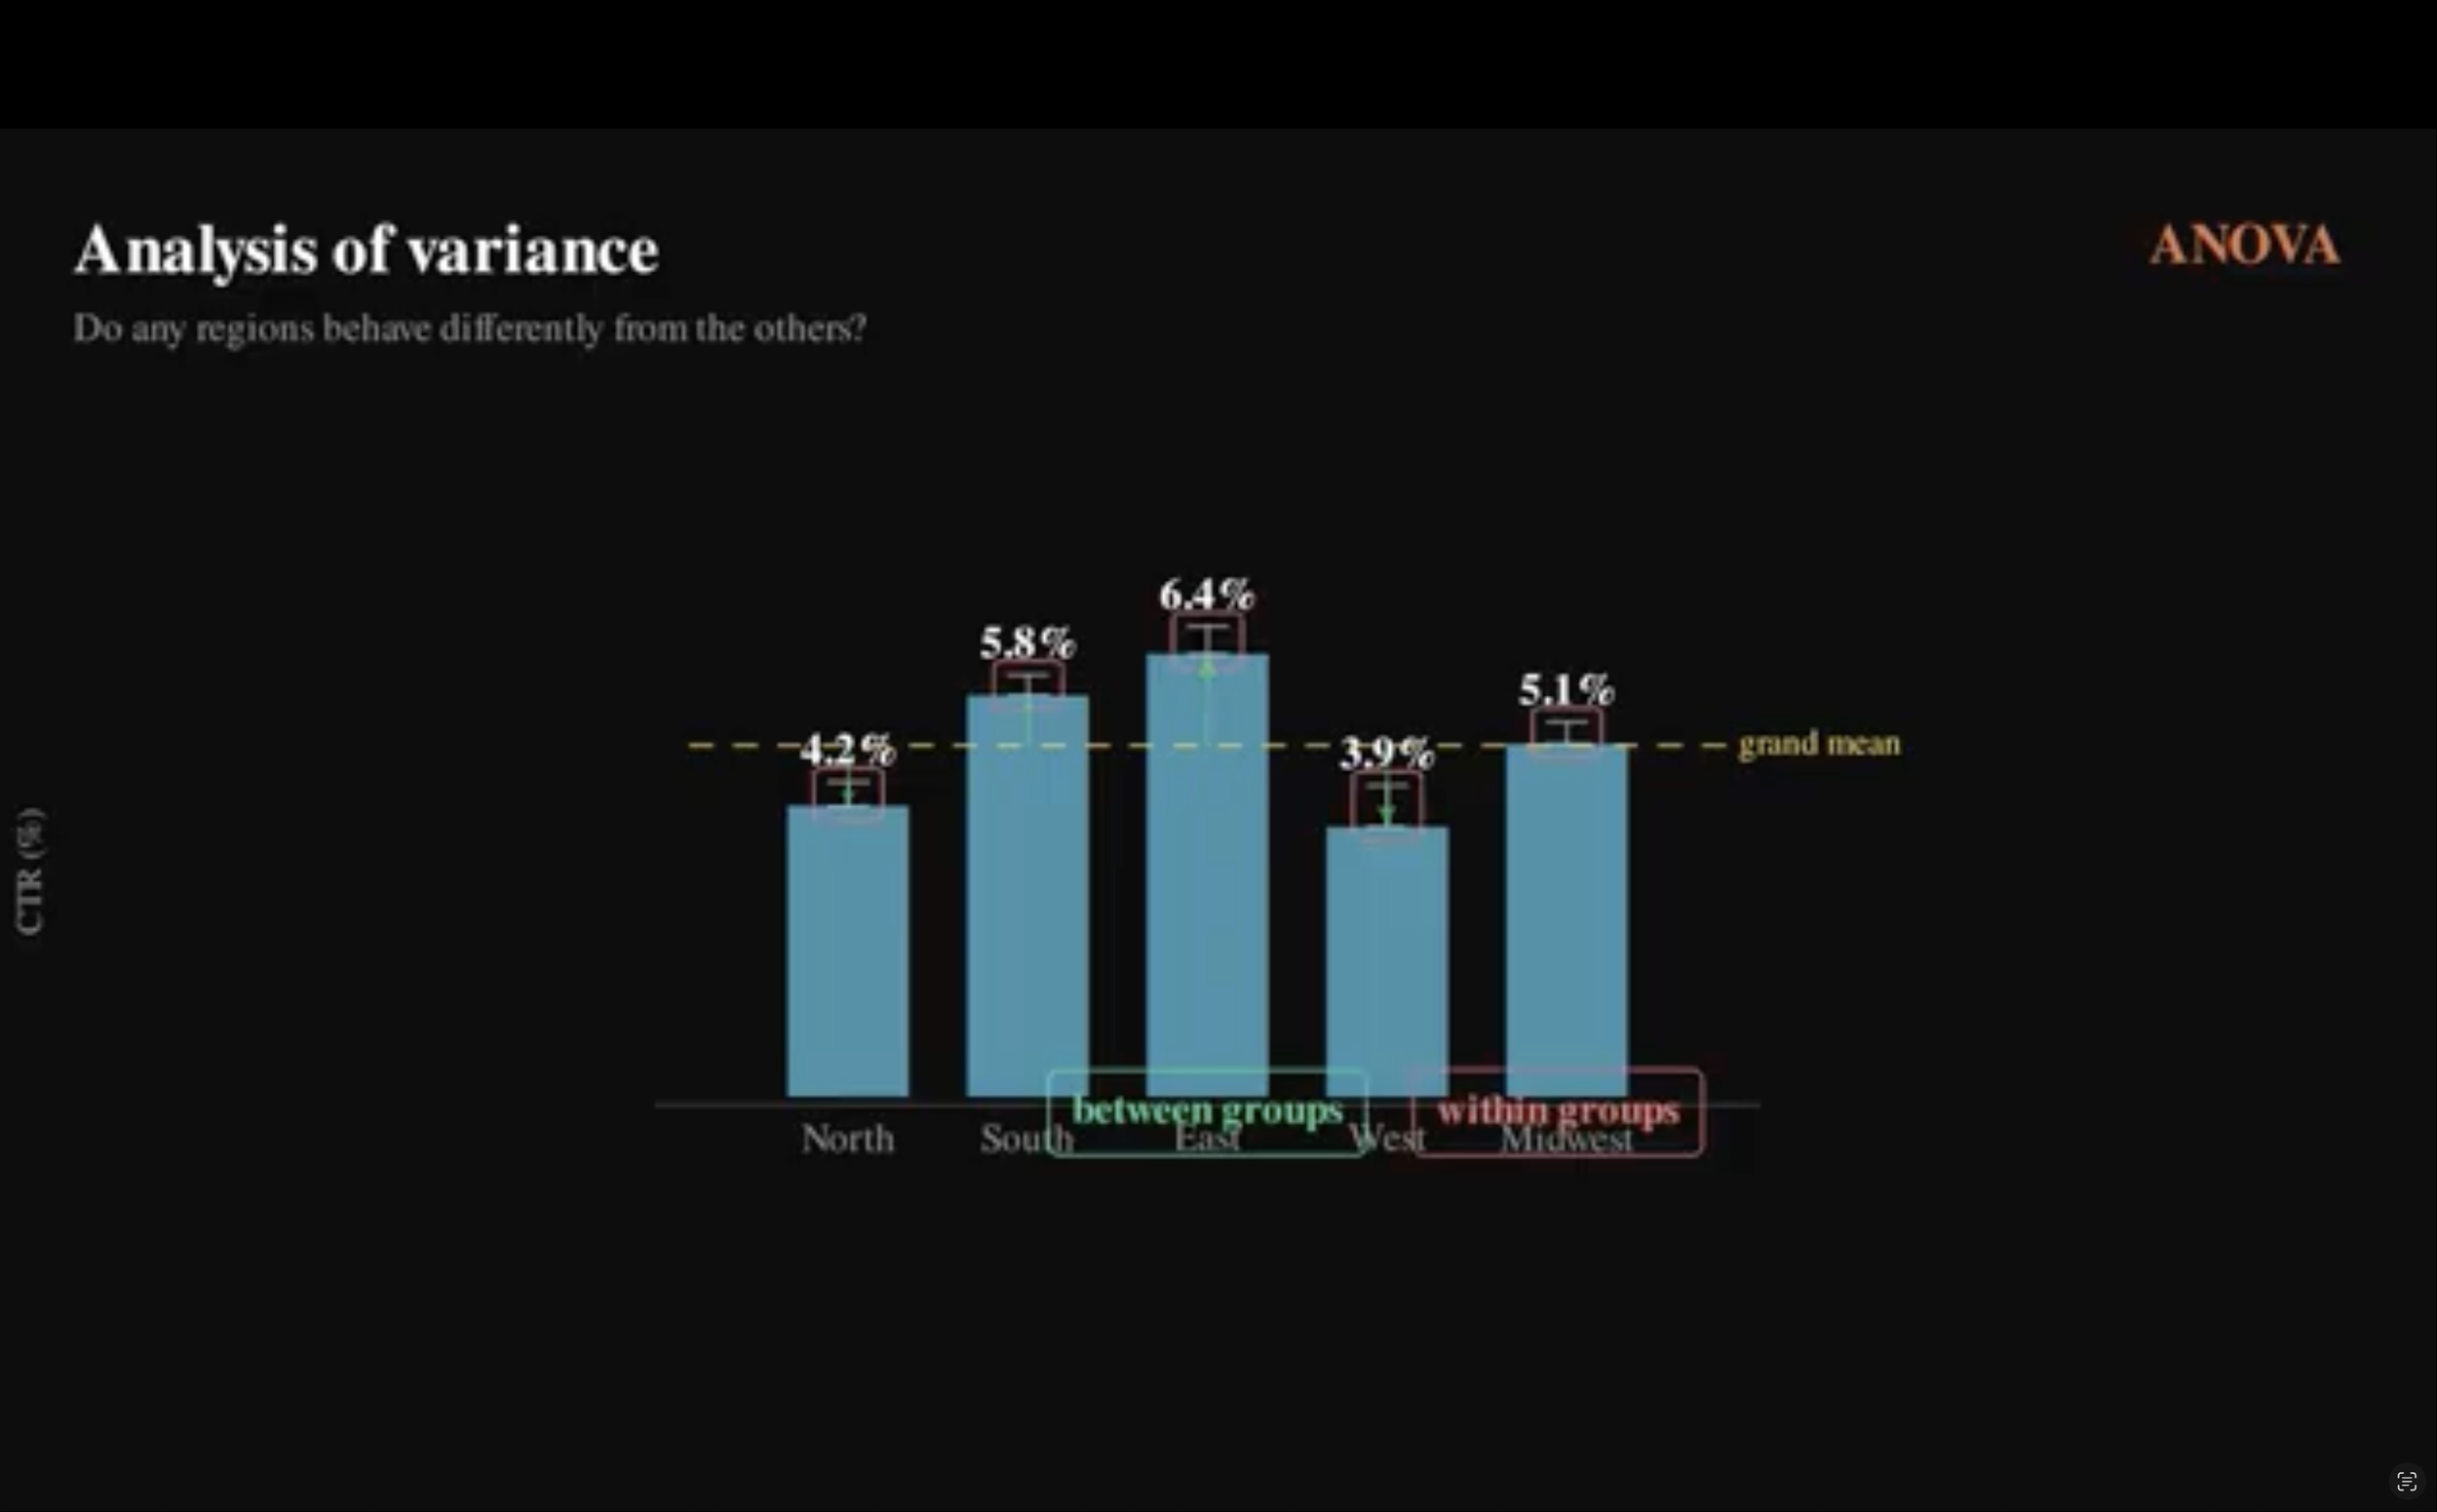
Table used on ANOVA to compare the variation between groups and within groups
Now the question is whether any of these groups behave differently from the others. That’s what ANOVA tests. It compares the variation between groups to the variation within groups. If the differences between groups are large relative to the noise within them, then at least one group is meaningfully different.
But ANOVA doesn’t tell you which one. It tells you that something is different, not what is different. For that you'd need to go a level deeper with something like Tukey’s Honestly Significant Difference (HSD) Test. ANOVA is the filter. It tells you whether it's worth digging further.
Four tests, four situations. And if your boss walked in right now and asked which one applies to your checkout data, could you answer?
How to actually choose
Instead of memorizing formulas, think in terms of situations. If you have a large dataset with known variance, use a z-test. If you have a small sample or unknown variance, use a t-test. If you’re dealing with categorical outcomes, use a chi-square test. If you’re comparing more than two groups, use ANOVA. And before any of that, decide whether you care about one direction or both.
Here’s what actually comes up in data science interviews. They won’t ask you to recite formulas, they’ll give you a scenario and ask which test you would use and why. You ran an experiment on 20 users, conversion went up, was it significant? Small sample, unknown variance, that’s a t-test. Two-tailed, unless you had a strong prior reason to only care about increases. The formula is almost never the answer they want. The reasoning is.
Anyone can report a result. Anyone can say revenue went up. The real skill is proving whether that result means anything. Did it actually work, or did you just get lucky? That’s the question hypothesis testing is built to answer.
Our closed beta is launching TODAY!. Sign up via the link below and keep being Evil